Legacy Excel Add-in
Introduction
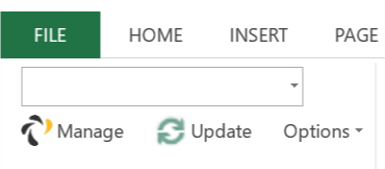
The Flex Legacy Excel Add-in adds some new tabs to the ribbon bar in Excel. Using these new tools, you can query data from your Xero accounts.
Downloading & Installing
- Login to your Flex account
-
Click Download the Legacy Excel Add-in

- Follow the prompts until done and start Excel.
Uninstalling
- Close down Excel
- Open Add or Remove Programs and search for FlexFinancialReporting
- Select it and click Uninstall
Logging in to your account
-
Select either the Xero tab

-
Click Update under the connection list
-
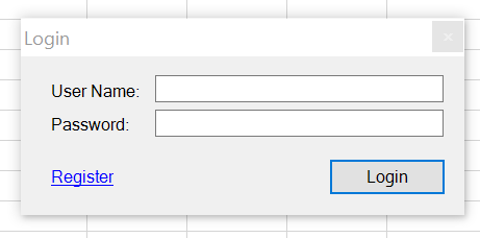
Log into your Flex Account
-
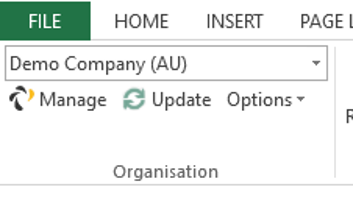
Your connection list should refresh with all the connections that you've setup.
Getting Data
Xero API Documentation
Whilst we do our best to keep Flex up to date with changes in these API's, if you find some data is available in the API but not in Flex, send us an email at support@flexfinancialreporting.com and we'll try add it for the next release.
After you have logged into your account and selected a connection, you can click any of the tables to get data.
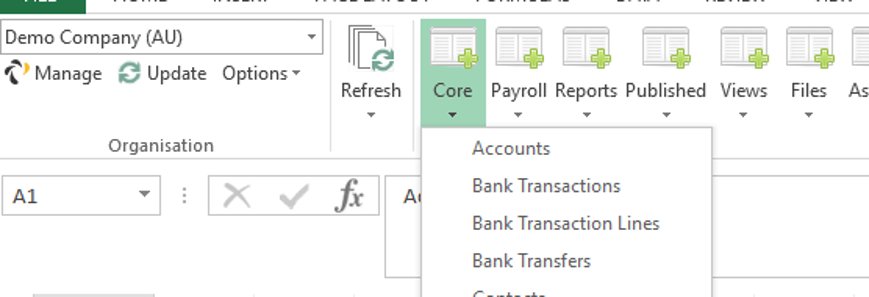
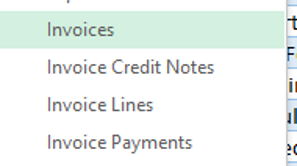
Once you click on a table, you will see a filter screen that will allow you to narrow down the data that you request (See Table Filters). Some tables may have nested data e.g. in Xero, Invoices can have Credit Notes, Invoices Lines and Payments.
Nested tables will generally show a few key columns from the parent table as well as columns from the nest data; this makes reporting a lot easier.
When you click OK on the filter, Flex will create a table with your data.
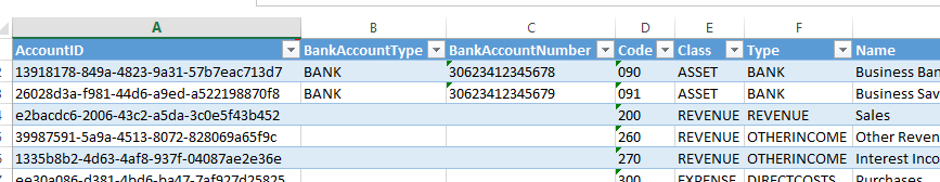
Table Filters
When you select a table, you will get a filter that allows you to limit what data you get from either Xero. Available filters are dictated by what the API supports; therefore some tables have better filtering than others.
Some filters allow you to set date ranges, these can very useful.
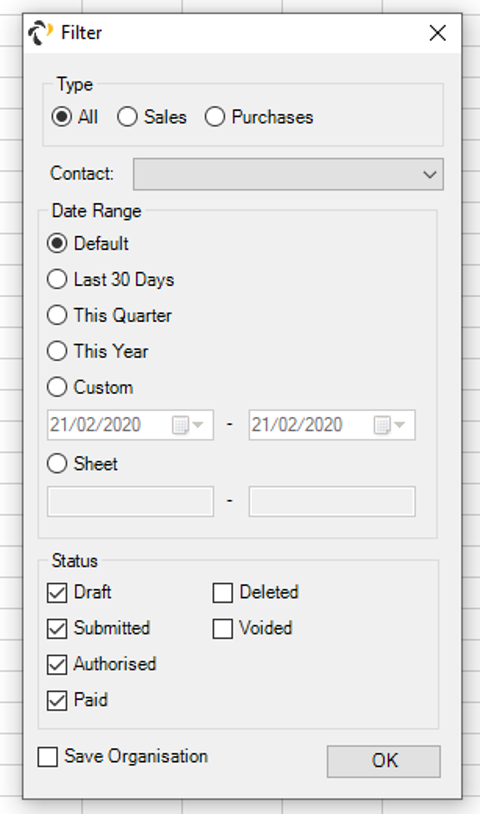
The ranges available are:
- Default - This will return whatever the API uses as default. This change on a table by table basis
- Last 30 Days - From 30 days ago until now
- This Quarter - The current financial quarter
- This Year - From the 1st of January of the current year
- Custom - Allows you to enter the dates
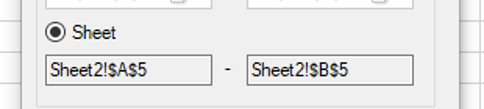
- Sheet - Use an Excel sheet reference to set the date
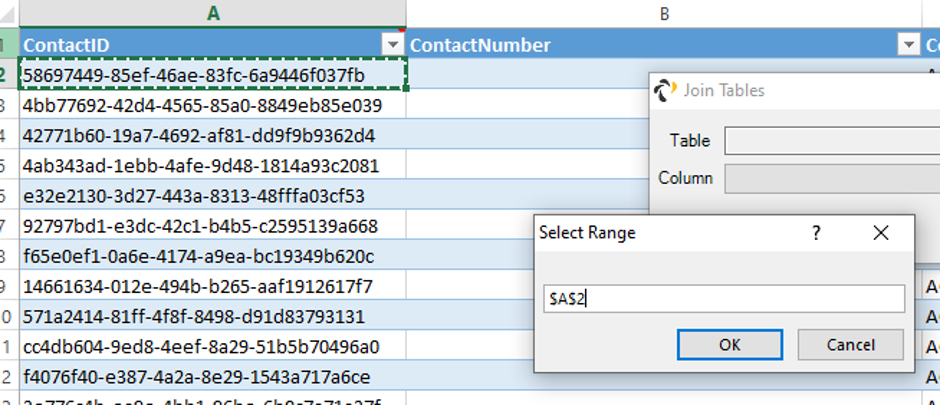
Using Sheet references to set the date
When you select the Sheet option in a date range filter, click the box(es) below to open the Select Range tool.
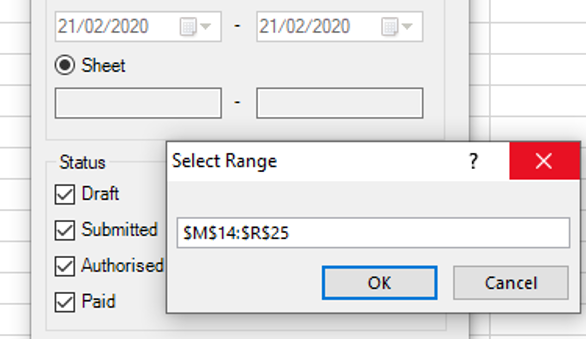
Then either type in or click the cell with the appropriate date and click OK. Repeat this if necessary if there are two dates.
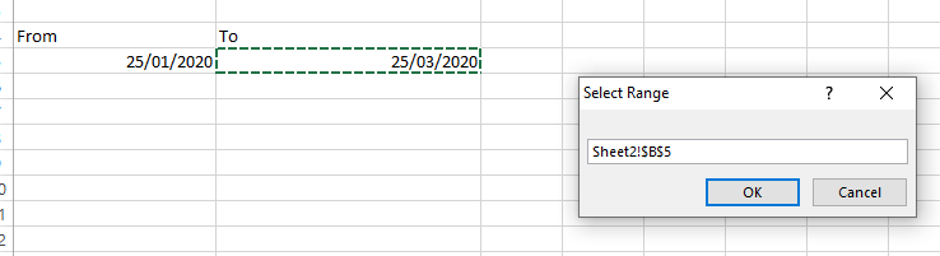
When you're done, the sheet reference will be saved in the filter. You can click them again if you want to change them.
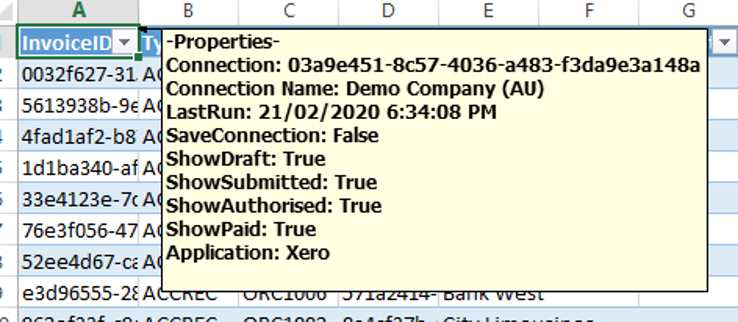
Once you're done, press OK and your table will be created. You can see a summary of the filters on an existing table by hovering your mouse over the cell in the top left.
Save Organisation
Save Organisation works when you run Refresh All. It will remember what company you had selected in the connection list and refresh data from that company instead of the current one. This is useful for when you want reports for specific companies.
Refreshing Data
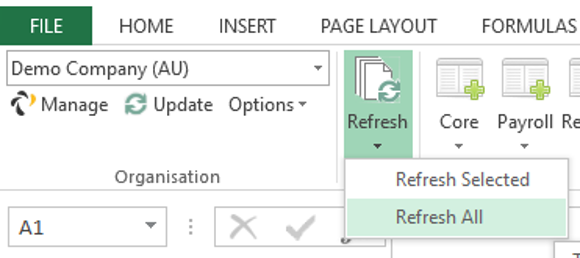
Once you've got some data or built a report, you'll want to refresh it with the latest data. You can find the Refresh menu in the Xero tab.
Refresh Selected
Refresh Selected will open the table filter of the currently selected table and allow you to refresh the data. To select a table, click anywhere within the bounds of that table. This will allow you to adjust the table after it has been created. Press OK on the filter to run the table again and data will be refreshed from the currently selected company.
Refresh All
Refresh All will rerun all tables using the filters last used. Data will refresh from the currently selected company unless you ticked the option for Save Organisation.
Refresh all will update in the following order:
- All Flex Tables
- All Flex Combined Tables
- All Flex Joined Tables
- All Excel data sources (e.g. pivot tables)
Reset Table
The Reset Table option can be found under the Flex tab in the Options menu.
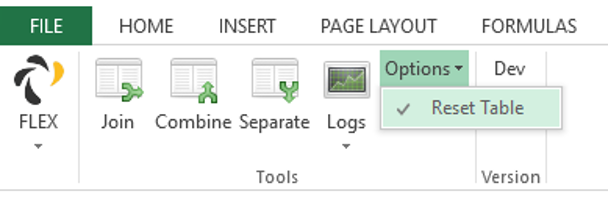
With this option ticked, any removed columns will be restored and new columns will be removed; the table will reset back to the default columns.
With the option unticked, you can remove columns, move them around and even add new columns with calculated data.
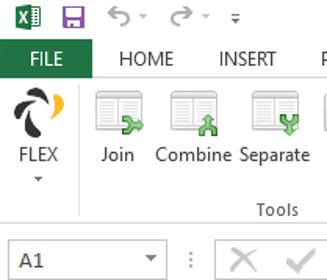
Join Tool
You can find the join tool in the Flex tab of the ribbon bar.
The Join Tool allows you to connect two tables together and make a new joined table by linking them with a matching column on each table.
If you're familiar with SQL, this is similar to an INNER JOIN. You can join any table using any column though you might want to stick to ID columns for best results.
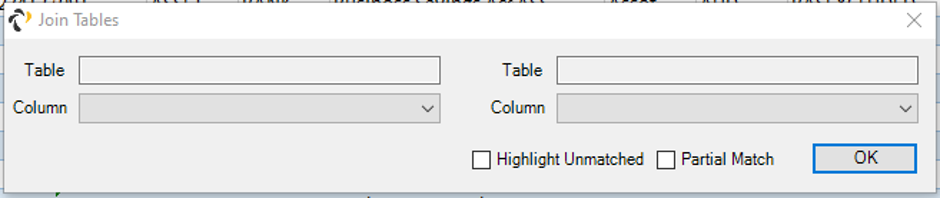
Click on the box labelled table to open a Select Range tool, then click the column you want to join from.
Then repeat for the column you want to join to. By default, Flex will choose the table and column you have clicked, but you can adjust the column from the dropdown list.
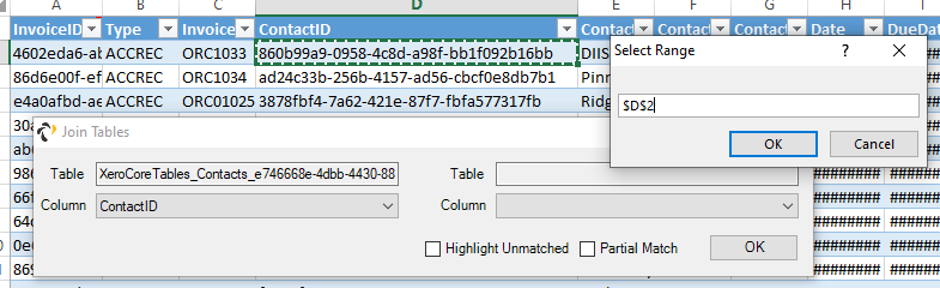
Then press OK and a new Joined table will be created which all includes columns from both tables.
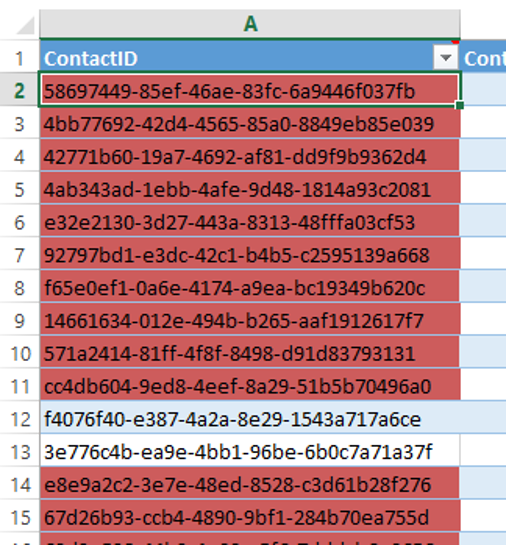
Highlight Unmatched
Ticking the Highlight Unmatched option will colour all cells that could not be matched between the two tables
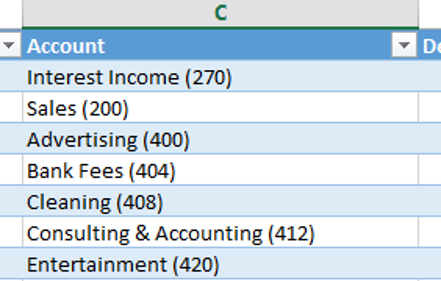
Partial Match
Partial match will match the right table if it can be partially found on the left table. Use this when part of your matching criteria is in the same cell as other data.
In the picture below, even though the Account Name and Account Code are in the same cell, we can still do a partial match on the Code to the Code on the Accounts table.
Combine Tool
You can find the join tool in the Flex tab of the ribbon bar.
Use the Combine Tool when you want to combine several similar tables together. Tables will be appended to each other and an additional column will be added as a grouping identifier.
Here we'll step through how to create a consolidated P&L through Xero. First, create 2 or more P&L reports from different companies (make use of the Save Organisation option in the filter, this will allow you to refresh all data in the workbook at anytime using Refresh All).
Then click the Combine Tool button.
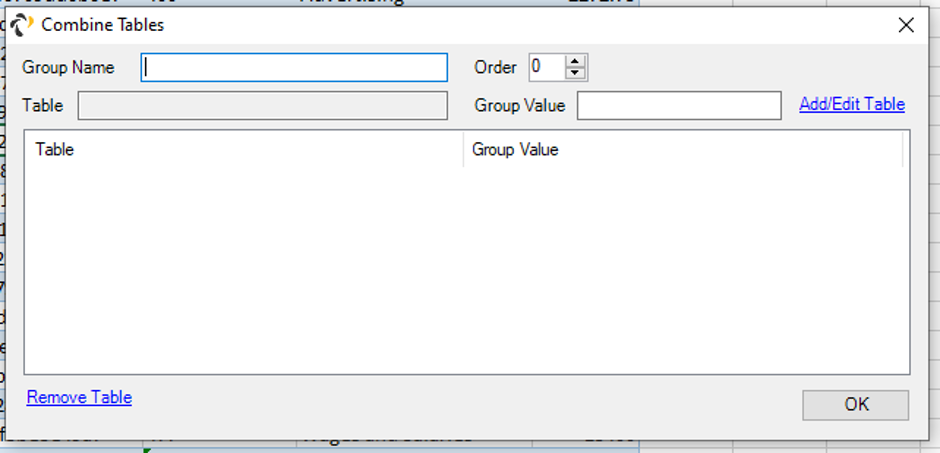
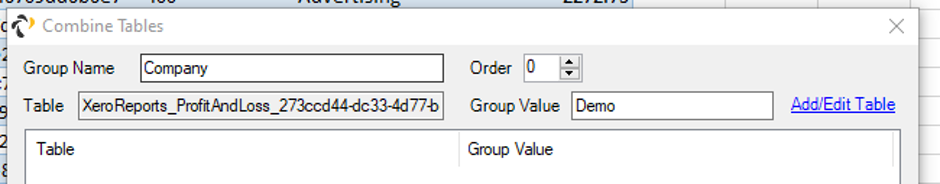
The Group Name is the name of the column that will be added to the new table. For this example, each of our tables that we want to combine are from a different company, so we'll enter 'Company'.
In the box beside table, click on it to open the Select Range Tool then click on one of the P&L tables and press OK. Next we have to enter the Group Value.
The Group Value is the cell data that will appear under the Group Name column for every row in this selected table. For this example we'll type in the company name then Press Add/Edit Table.
Repeat these steps for each table, then press OK.
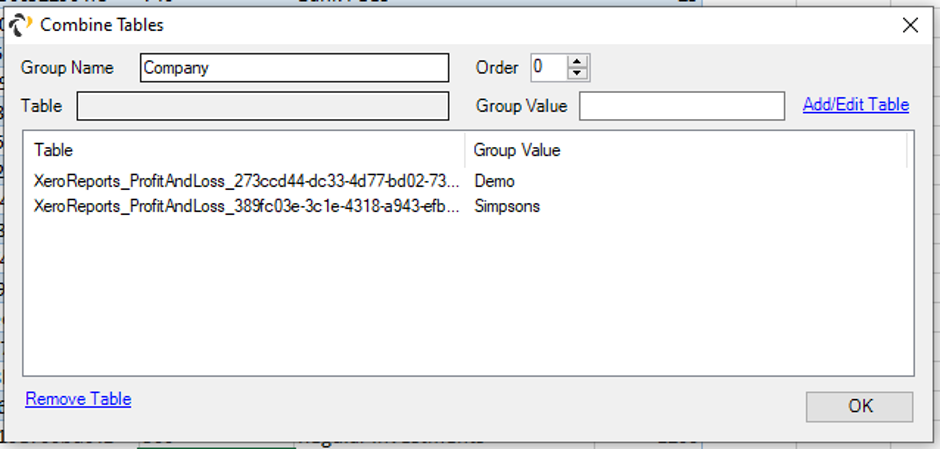
A new table will be created with all tables you configured in the Combined Tool plus the grouping column.
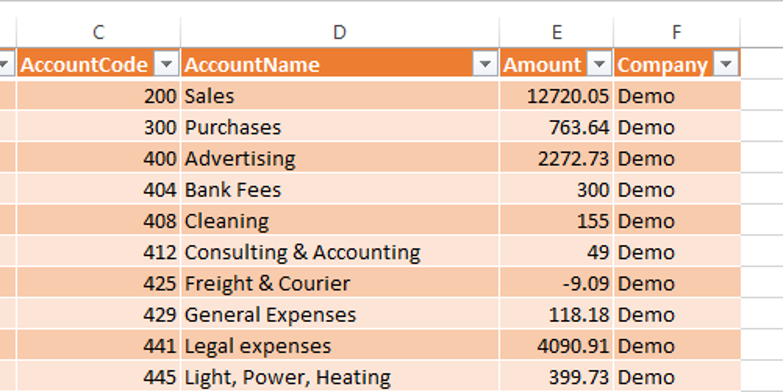
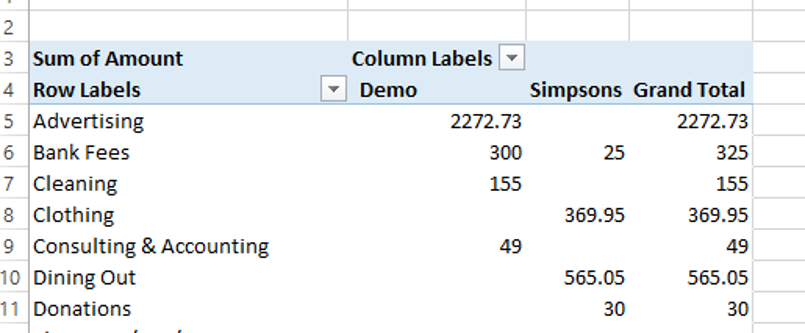
This makes it easy to create Pivot Tables and collate data into one report.
Separate Tool
You can find the join tool in the Flex tab of the ribbon bar.
The Separate Tool allows you split any table by the distinct values on a selected column into separate tables on new worksheets.
For example, to split the invoices by Status, click anywhere on the Status column, then click the Separate Tool. This will then create a worksheet with a table for each of the distinct Status values.
Caching Data
Data caching is a powerful technique that can dramatically improve the performance of your reports and help you avoid API rate limits. Instead of downloading the same historical data repeatedly, you can cache (store) old data locally and only refresh recent changes.
Why Cache Data?
There are several compelling reasons to implement data caching:
- Performance: Dramatically faster refresh times, especially for large datasets
- API Limits: Avoid hitting rate limits imposed by Xero APIs
- Reliability: Reduce the chance of timeouts and connection issues during large data downloads
- Efficiency: Historical data (like old journals or invoices) rarely changes, so re-downloading is wasteful
How to Cache Data
The caching process involves creating two tables: one for historical data (disconnected from refresh) and one for recent data (connected for regular updates). Here's the step-by-step process:
- Download the complete dataset - Get all your historical data first
- Rename the table - Change the table name so Flex ignores it during "Refresh All"
- Create a new table - Set up a second table for recent data only
- Apply appropriate filters - Use date filters to get only new/recent records
- Combine the tables - Use the Combine Tool to merge cached and fresh data
When Flex creates a table, it uses a specific naming convention like "XeroCoreTables_Journals_bafde5f9_a717_4217_b070_e7d2fdb08d12" and stores this exact name internally to identify which tables to refresh during "Refresh All". By renaming a table (for example, changing "XeroCoreTables_Journals_bafde5f9_a717_4217_b070_e7d2fdb08d12" to "Journals_Historical"), you break this connection because Flex can no longer find a table with the original name. This effectively "disconnects" the table from the refresh process, turning it into static cached data. The renamed table will remain exactly as it was when you renamed it, preserving your historical data while allowing you to create new tables with the original name that will refresh normally. This is why renaming is such an effective caching strategy - it's a simple way to preserve data without any complex configuration.
Practical Example: Caching Journals
Journals are an ideal candidate for caching because they're numerous and historical entries never change. Here's how to set up Journal caching:
- Download all Journals - Create a Journals table with no date filters to get all historical data
- Rename the historical table - Change the table name to something like "Journals_Historical" or "Journals_Cache". This disconnects it from Flex, so it won't refresh when you press "Refresh All"
- Create a new Journals table - Set up a fresh Journals table with a "Modified After" filter. Set the date to be after the latest date in your cached table
- Use the Combine Tool - Create a combined table that merges your historical cache with the new data. This gives you a complete, up-to-date view of all journals
- Refresh efficiently - When you press "Refresh All", only the new Journals table and the combined table will update, making the process very fast
Caching Other Data Types
While Journals have the special "Modified After" filter, you can cache any data type using date range filters. Most tables support "Date From" and "Date To" filters that you can use for caching:
- Invoices: Cache by year using "Date From/To" filters on the invoice date
- Bank Transactions: Cache older transactions and only refresh recent months
- Payments: Split by date ranges to cache historical payments
- Purchase Orders: Cache completed orders and refresh only recent/pending ones
Example for Invoices:
- Create an "Invoices_2023" table with Date From: 1/1/2023, Date To: 31/12/2023
- Rename it to disconnect from refresh
- Create an "Invoices_Current" table with Date From: 1/1/2024 (or current year)
- Use the Combine Tool to merge them into a complete invoice list
Best Practices for Data Caching
- Use clear naming conventions like "TableName_Historical", "TableName_Cache", or "TableName_2023"
- Consider creating separate worksheets for each cached year or period
- Document your caching strategy in your workbook for future reference
- Regularly review and update your cache boundaries (e.g., move current year data to cache annually)
Maintaining Your Cache
To keep your cached data system working efficiently:
- Periodic updates: Occasionally update your cache boundaries (e.g., at year-end)
- Monitor performance: If refresh times start increasing, consider expanding your cache
- Use Refresh Selected: Adjust filters on your current data tables as needed
- Combine Tool updates: Use Refresh Selected on combined tables to modify which tables are included
VBA & Automation
You can automate some of the features of Flex using VBA. To use the COM+ interface, use the following code snippet.
Dim addon As Office.COMAddIn
Dim automationObject As Object
Set addon = Application.COMAddIns("FlexFinancialReporting")
Set automationObject = addon.Object
The following methods are available.
void RefreshAll();
bool DownloadAllAttachments(int table, string id, string root = null);
bool DownloadInvoice(string id, string root = null);
string[] GetXeroConnections();
string GetXeroConnection();
void SetXeroConnection(string Connection);
object GetProperty(string table, string property);